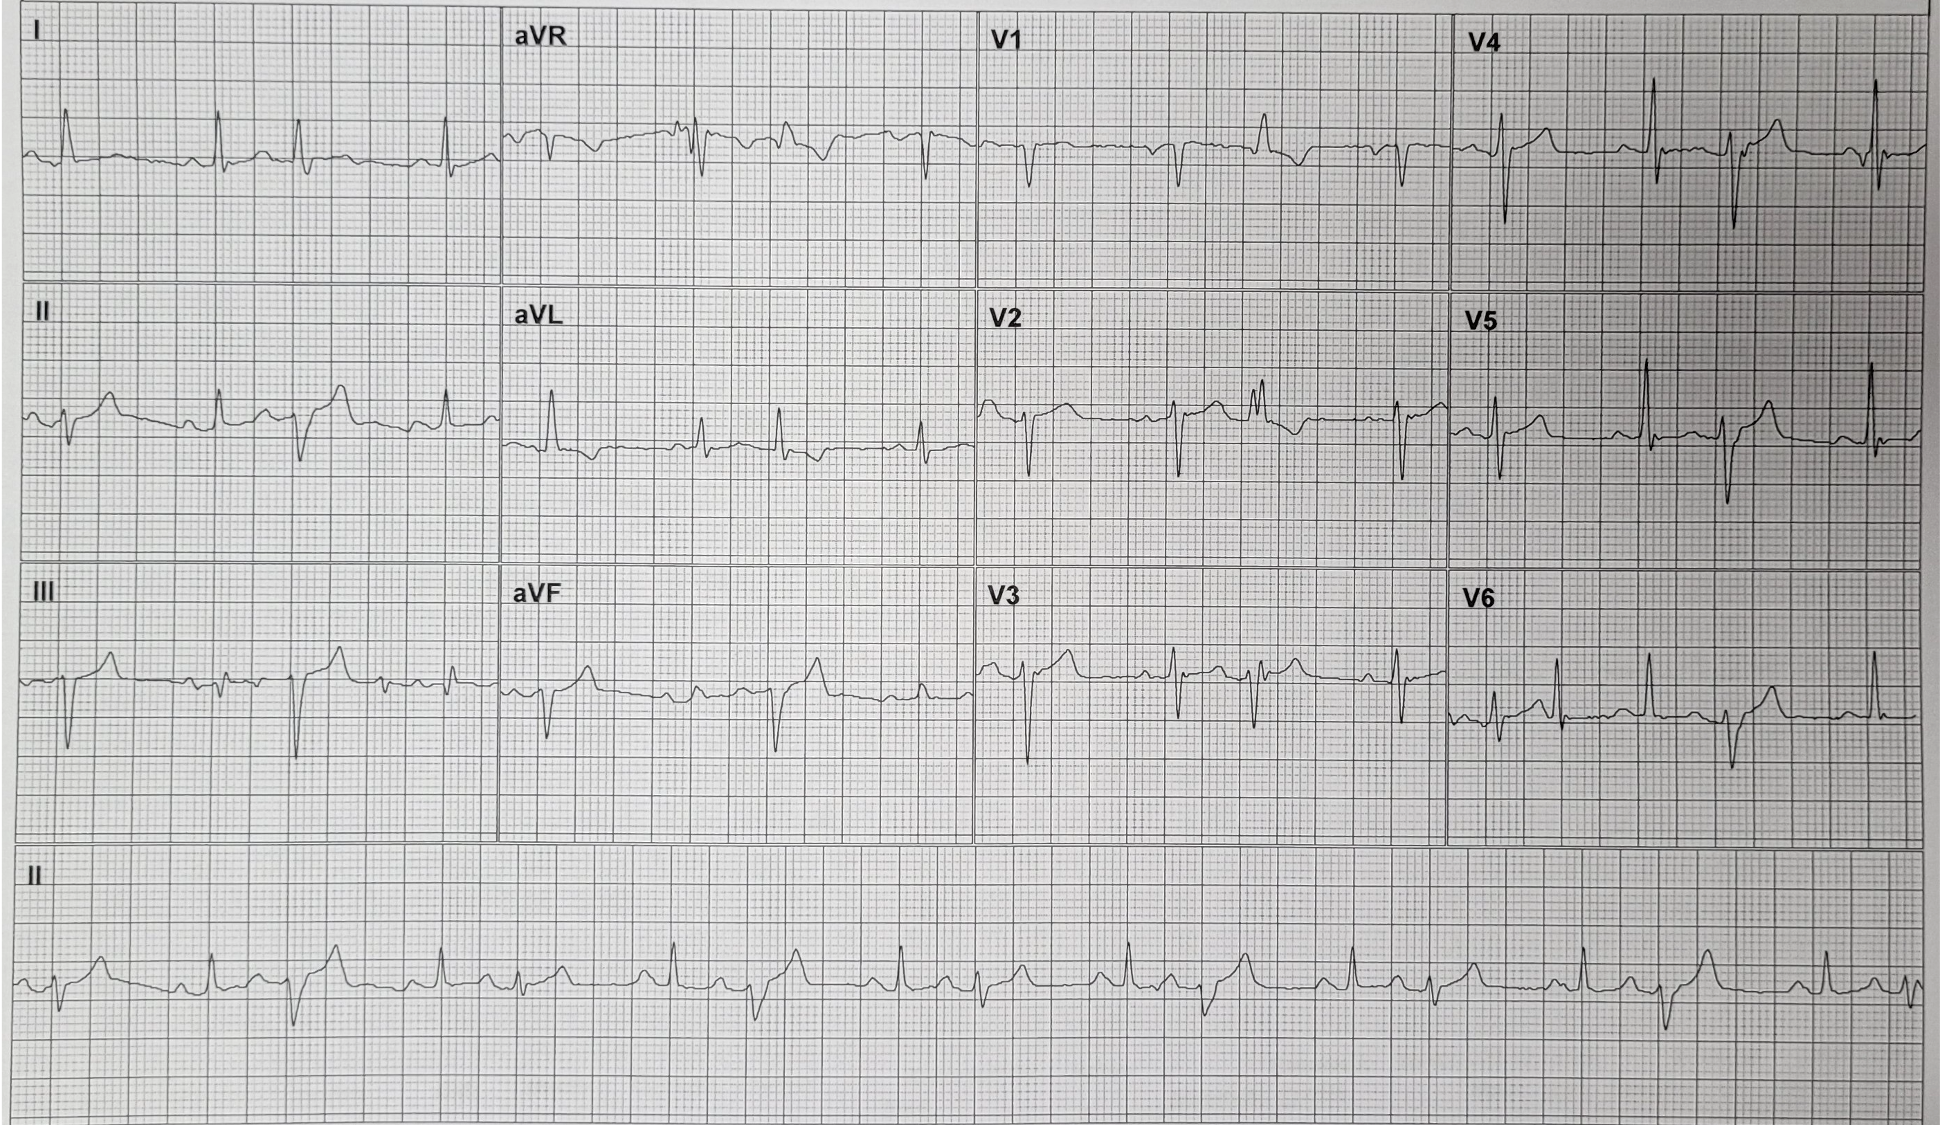
The format of the recording is such that every group of three leads shows the same 2.5 seconds of ECG. The lead II strip at the bottom is a 10-second serial recording.
Dr Dave Richley
Answer Added 23.10.24
It is evident from the rhythm strip that there is sinus rhythm with each sinus beat followed by a premature beat, the premature complexes alternating in shape. So, what is the origin of these premature beats? In figure 1 (below) I have indicated with arrows where I think there are premature P waves and labelled them P’. If I’m right, some of these are on top of the T wave of the preceding beat, and therefore difficult to make out, but some occur in the ST segment and so are more clearly visible. This means that sinus beats are alternating with atrial premature beats (APBs), so this is an atrial bigeminy, but why do the APBs have two different, alternating shapes that are different from the QRS complexes of the sinus beats?
In the lead II rhythm strip I have labelled the 3 different QRS shapes as QRS 1 (sinus beat), QRS 2 (one form of APB) and QRS 3 (the other form of APB) and because each group of 3 simultaneous leads in the 12-lead display shows the same, initial 2.5 seconds of ECG, I have labelled the complexes in V1 and V6 similarly. It is evident that QRS 1 – the sinus beat – has a normal axis and duration. QRS 2 also has a normal duration but shows a borderline left axis deviation of about -30 degrees and there is a change in the R wave progression in the chest leads, with a significant S wave persisting to V6. These changes may be due to rate-related left anterior fascicular block (LAFB) or at least partial block in the left anterior fascicle. QRS 3 has a big left axis deviation of about -75 degrees and a right bundle branch block (RBBB) morphology, as well as further alteration of the R wave progression with a dominant S wave persisting to V6. These changes probably represent rate-related LAFB and RBBB. The leftward shift in axis from QRS 2 to QRS 3 may due to a progression from partial to complete block in the left anterior fascicle.
In summary it seems that there is sinus rhythm with atrial bigeminy, the APBs showing alternating incomplete LAFB and RBBB with complete LAFB.
There are also some artefacts, such as the deflection in V6 that looks very much like a QRS, although it doesn’t appear in any of the other leads, and Arron Pearce, who provided the ECG, tells me that the artefacts were generated by the telephonic transmission system by which the ECGs were sent to the receiving centre.
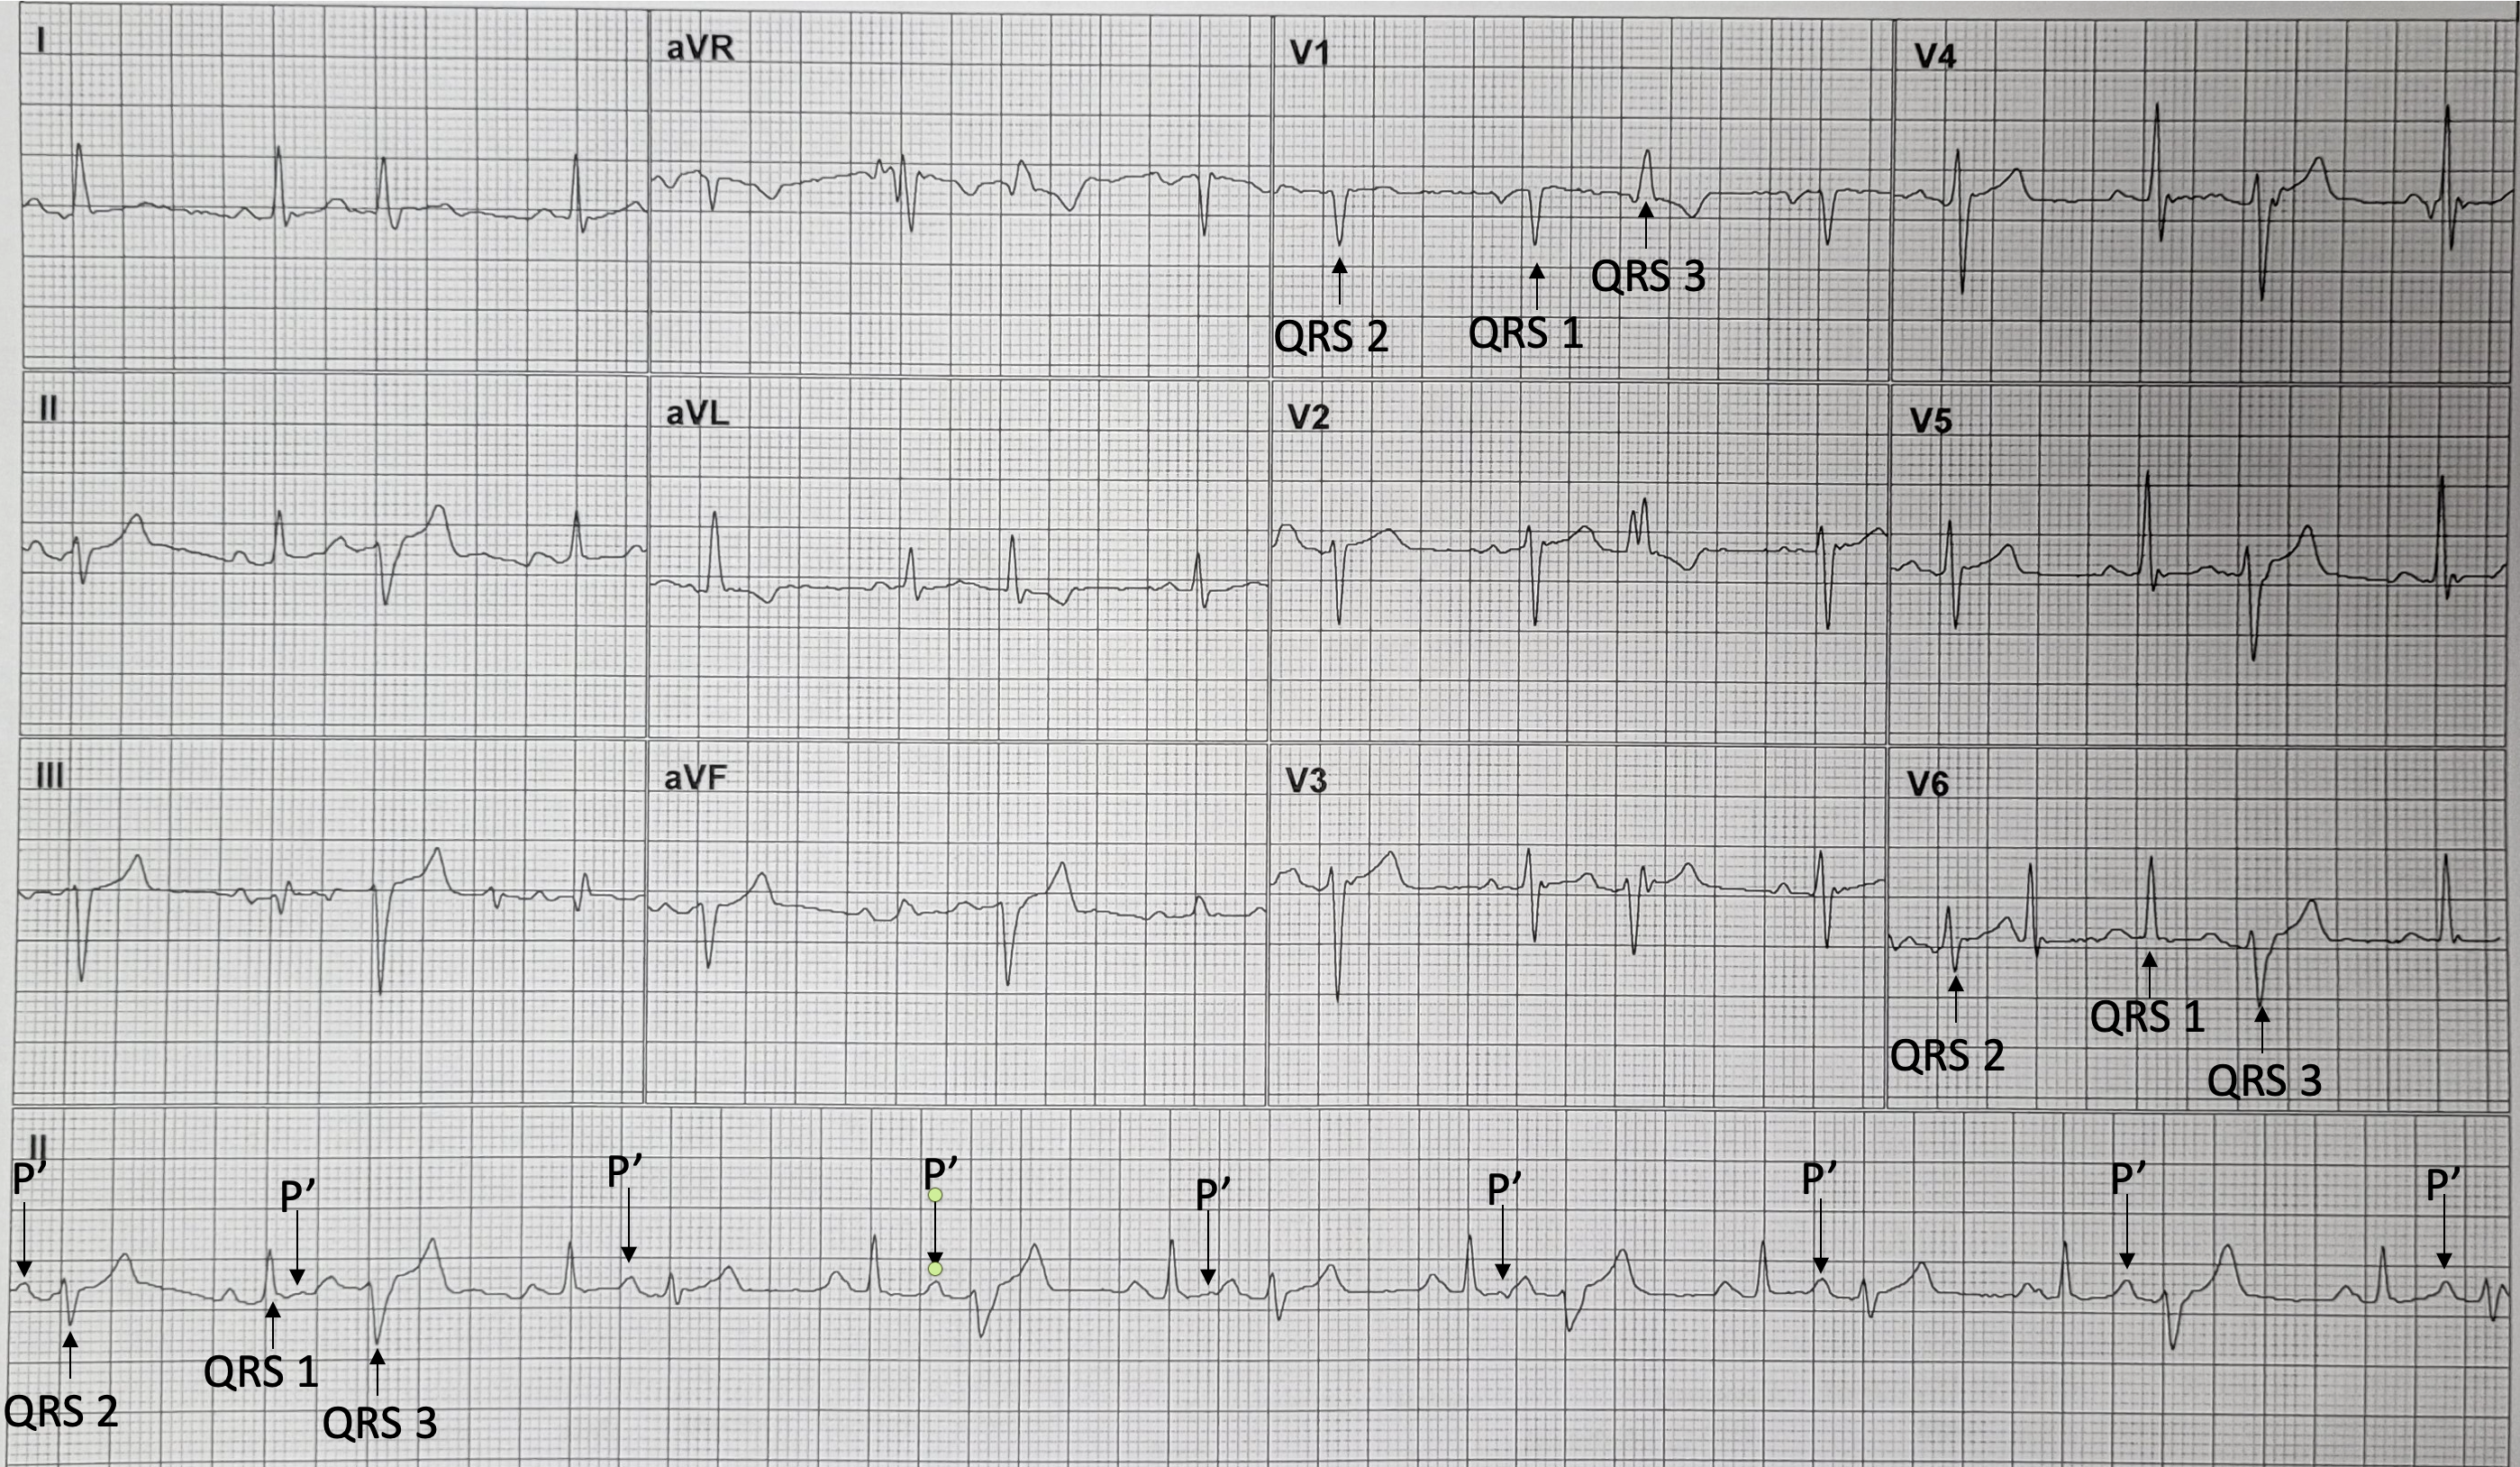
Figure 1. Premature P waves labelled P’, and 3 different forms of QRS complex labelled QRS 1, QRS 2 and QRS 3.
Dr Dave Richley
Lovely rhythm challenge, again.
Looks to me like a bigeminal rhythm — sinus beats followed by PACs and PVCs, in an alternating pattern.
R1, 5, 9, 13, 17 = PACs
R2, 4, 6, 8, 10, 12, 14, 16 = sinus beats
R3, 7, 11, 15 = PVCs
The PACs conduct with LAFB — maybe due to phase 3 block in the LAFB. We can tell these are atrial beats due to the slight distortion of the T waves of the preceding sinus beat. I cannot reliably see any such distortion preceding what I think are PVCs, so I can reasonably assume they are not supraventricular.
The PVCs are not very wide (QRSd ≈ 120-130 ms) and have RBBB + LAFB morphology, with a rS in V4-6, suggestive of a left posterior fascicle origin.
Thanks, Onyinye. Some great comments there. I’m not sure I agree with you 100% but then I’m not completely certain that I’ve got it right either. I think I’ll need to study it very closely.
I’m pretty sure that we have p-waves hidden in the t-waves of the aberrant complexes, making this is sinus/atrial tachycardia with 3:2 conduction (atrial rate around 150bpm). I haven’t worked out the mechanism causing alternating aberration of each 2nd complex yet though.
Thanks, Scott. I hadn’t considered what you suggest and I’m not sure that the timing of the clearly visible P waves supports it but I’m certainly going to study the ECG again and in more detail before I make up my mind.
It is particularly hard for me to be 100% sure because of the configuration of the ECG — the same 2.5 seconds reproduced in all 12 leads, except the rhythm strip…
I would like to modify my initial assessment by saying it could possibly be simply sinus rhythm with atrial bigeminy with alternating aberrancy of the ectopic atrial beats — LAFB aberrancy and RBBB+LAFB aberrancy.
Thanks, Onyinye. That’s also the direction I’m leaning in at the moment.
Looks like sinus rhythm followed by PAC and PVC; left ventricular bigeminy; bundle branch block
Thanks, Tenisha. Are you sure there are PVCs? I have my doubts!