Dr Dave Richley
Answer Added 19.09.24
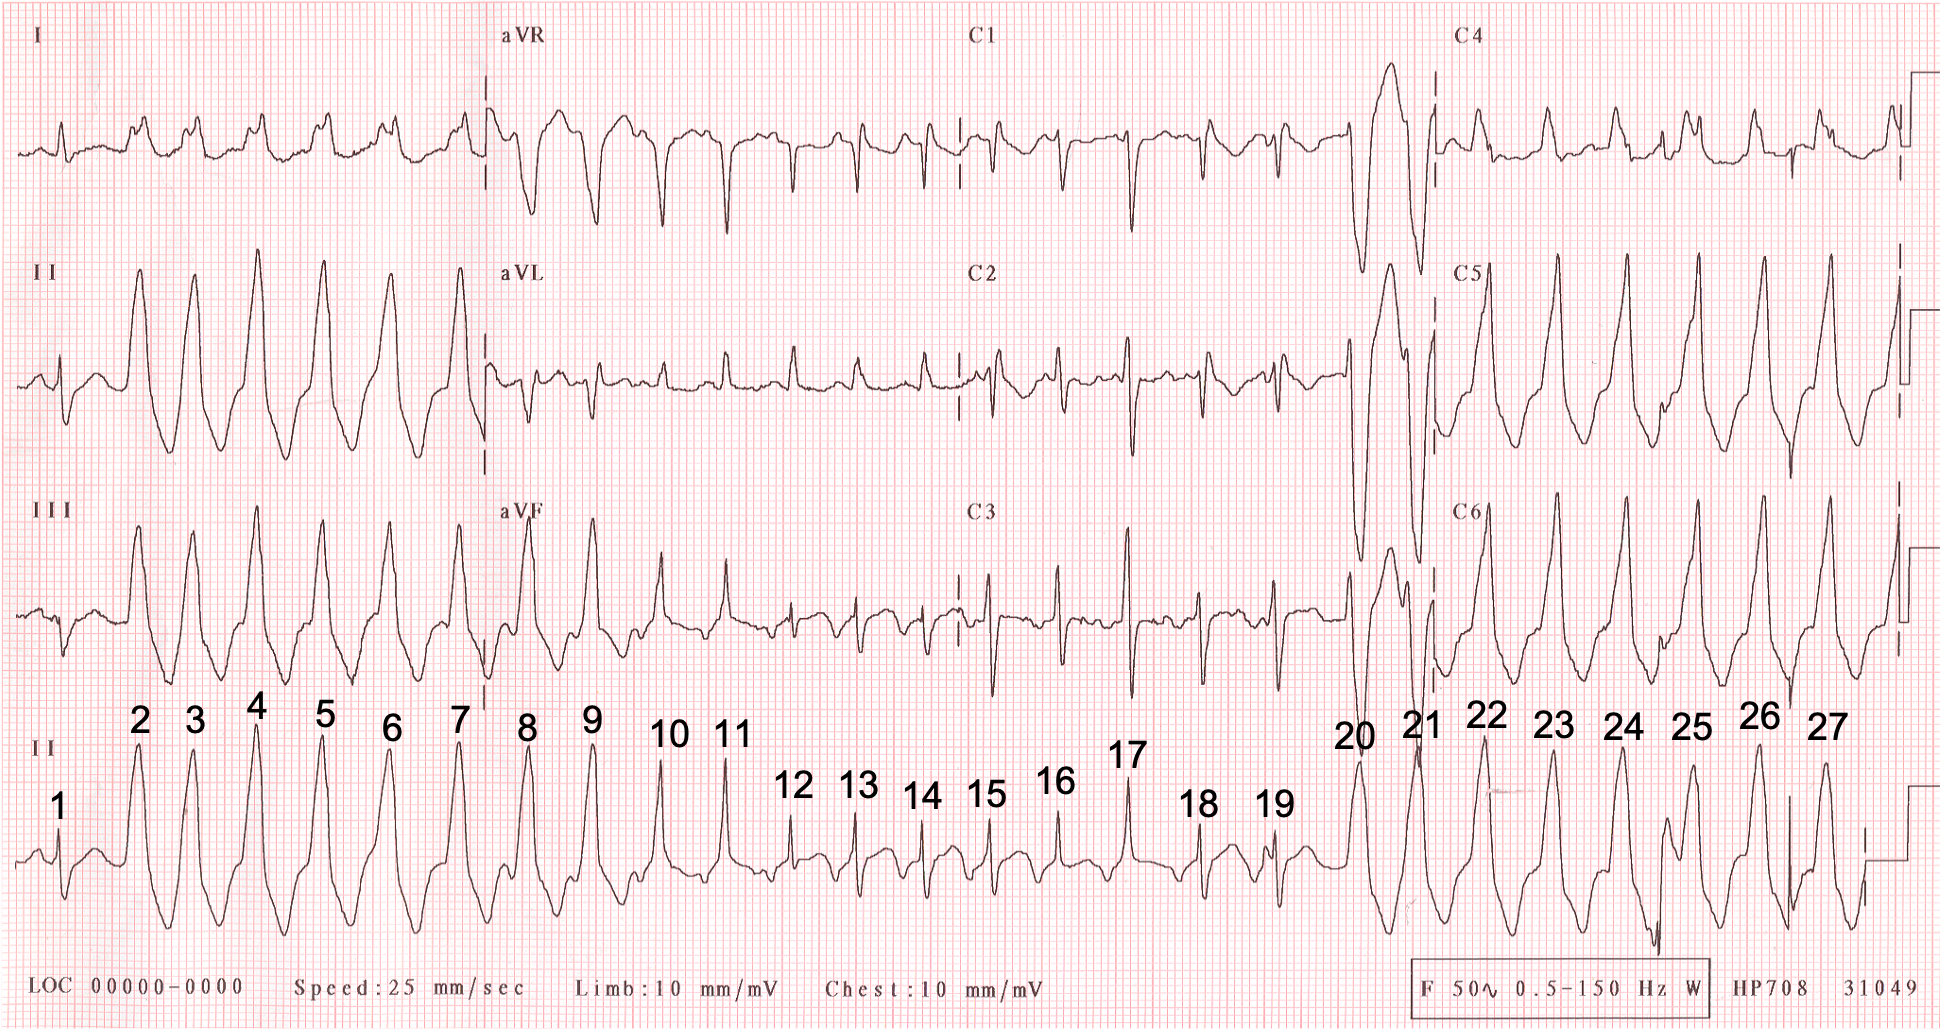
So, what’s going on here? After the first beat, which is of sinus node origin, I think a run of VT starts and that this triggers a simultaneous run of SVT – probably an AVNRT – which stops after a few beats, leaving just the VT.
There is much of this ECG that I find it difficult to be certain of but I’ll explain what I think is happening throughout the tracing.
The QRS of beat 1, the presumed sinus beat, is broad with a duration of 120 ms, mainly as a result of a broad S wave, so I suspect there is right bundle branch block, although it would have been nice to be able to see this beat in the chest leads to determine whether this is in fact the case.
Beat 2 is the start of a broad QRS tachycardia. A regular broad QRS tachycardia should be assumed to be VT unless it can be proved otherwise and there is no reason to think that this is not VT. The tachycardia starts slightly irregularly but this is common with VT. As Ōkóyè Ō pointed out, the tachycardia has an inferior QRS axis and a left bundle branch block morphology, which is typical of a right ventricular outflow tract VT.
Just before beat 8 is a P wave that I think is positive in lead II and therefore of sinus node origin and representing AV dissociation, which is common in VT. However, I do wonder if this is actually a negative P wave, reflecting retrograde conduction form the ventricles over the atria – it depends on how you look at it. Still, this is not really important.
What happens next is, if I’m right, unusual and interesting. QRS complexes 9-19 are different in shape from the VT complexes and often different from each other. Beat 9 is only minimally different – the R’ wave in aVL is slightly bigger and the S wave slightly smaller – but some of the other beats vary markedly in shape, duration and polarity from the VT complexes.
My guess is that there are two AV nodal pathways and that ventricular impulse number 8 manages to conduct retrogradely over one of the pathways and depolarise the atria, producing the negative P wave immediately before beat 9. More importantly, the impulse returns to the ventricles via the other AV nodal pathway with the result that beat 9 is a fusion beat because the ventricular focus continues to discharge at its own inherent rate. This process continues, with each impulse that travels down one AV nodal pathway returning via the other. Every time this happens the atria are activated retrogradely, producing a negative P wave, and the ventricles are activated partly antegradely in the usual way and partly retrogradely from the ventricular focus which continues to discharge. Thus, there appear to be simultaneous AV nodal reentrant and ventricular tachycardias with the result that beats 9 to 19 are all fusion beats with varying amounts of fusion. I think that even beats 13-15 and beats 18 and 19, which are very similar in shape to beat 1, are fusion beats, albeit with minimal fusion, because they appear very slightly different from each other and to have a narrower S wave than beat 1. The RP interval – representing the duration of retrograde conduction – appears to increase towards the end of the run of fusion beats (see figure 1) and after beat 19 the retrograde AV nodal pathway is too ‘fatigued’ to conduct with the consequence that the AV nodal circuit is broken. Beats 20 to 27 are therefore simple VT.
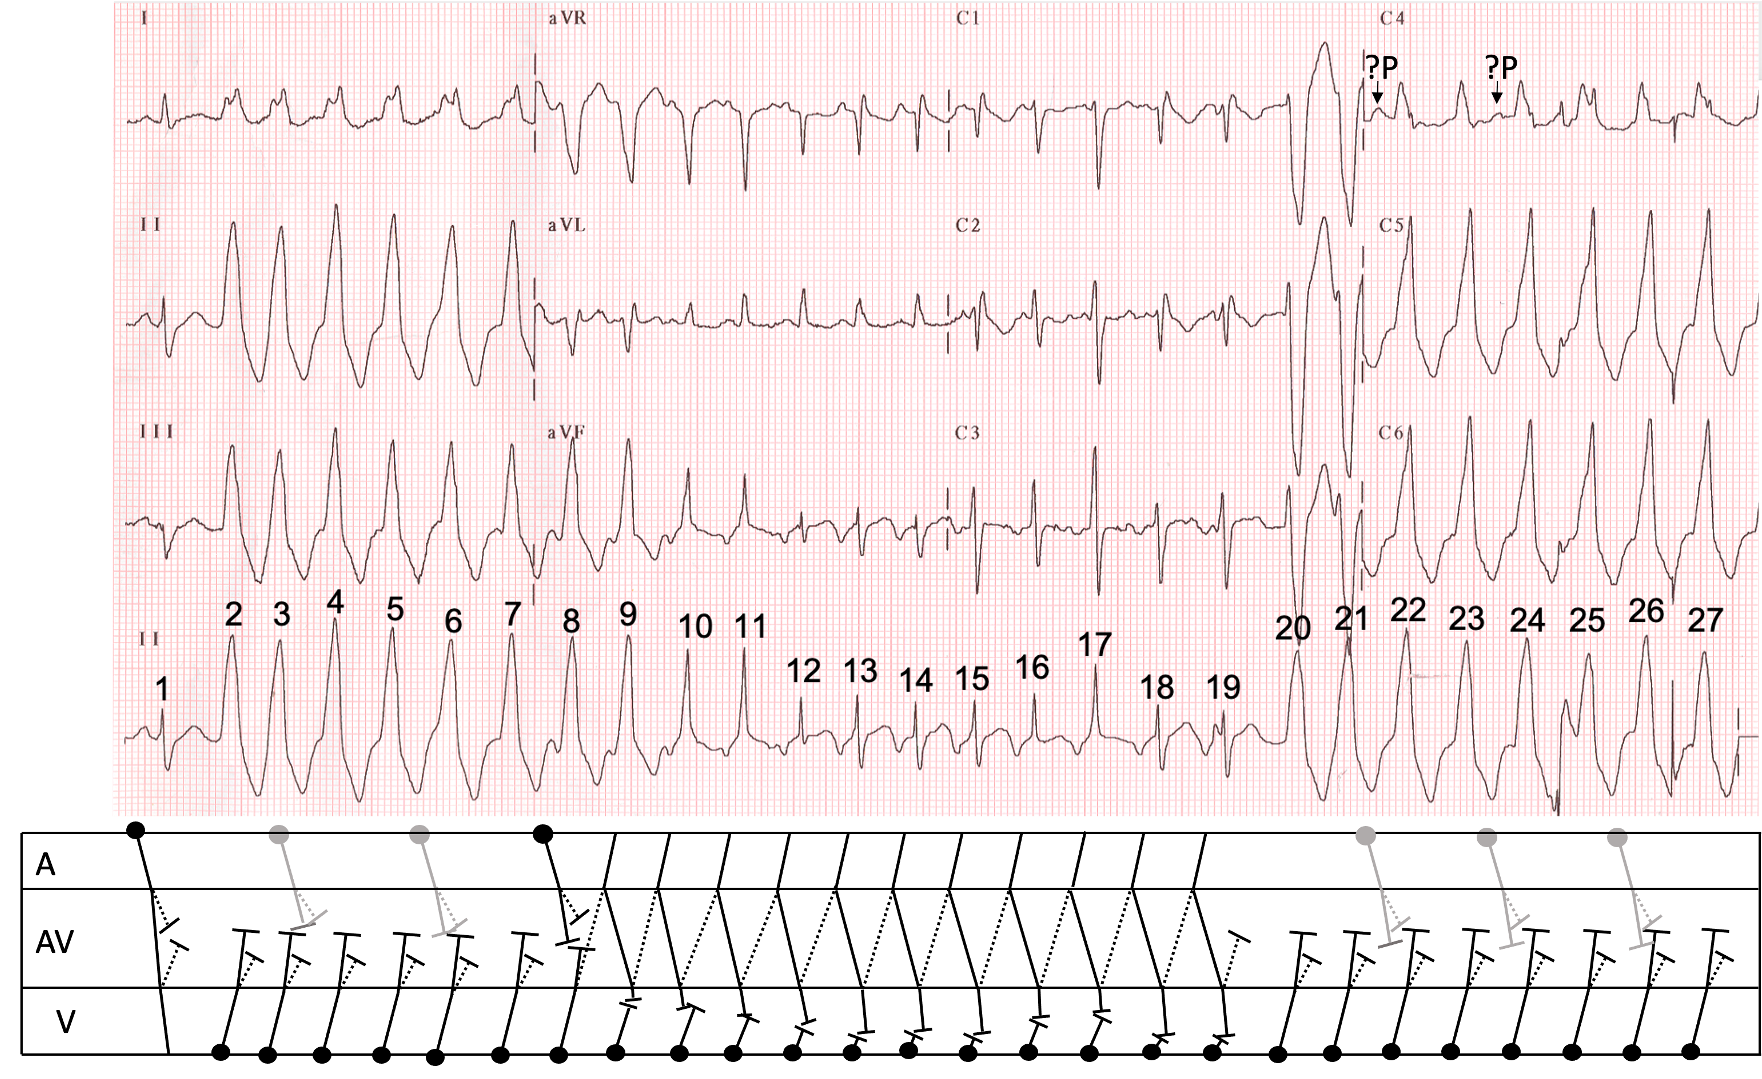
I have tried to illustrate all of this with a laddergram (figure 2). There is much detail that I‘m just not sure of, so some of this is very speculative. For instance, I’m not sure how many sinus beats there are, and where they are, so most of these on the laddergram have been represented in grey rather than black to reflect this uncertainty, but this is not of importance to the central hypothesis. Antegrade AV nodal conduction is shown to take place down a ‘fast’ pathway and is represented by an unbroken line; retrograde conduction is shown up a ‘slow’ pathway, represented by a dotted line. This would mean that the AVNRT is an atypical (or ‘fast-slow’) variety.
Is this explanation plausible, or is it nonsense? Are there any fatal flaws with this model that I’ve missed? Do you have any alternative explanations that make sense? Please let me know what you think.
Dr Dave Richley
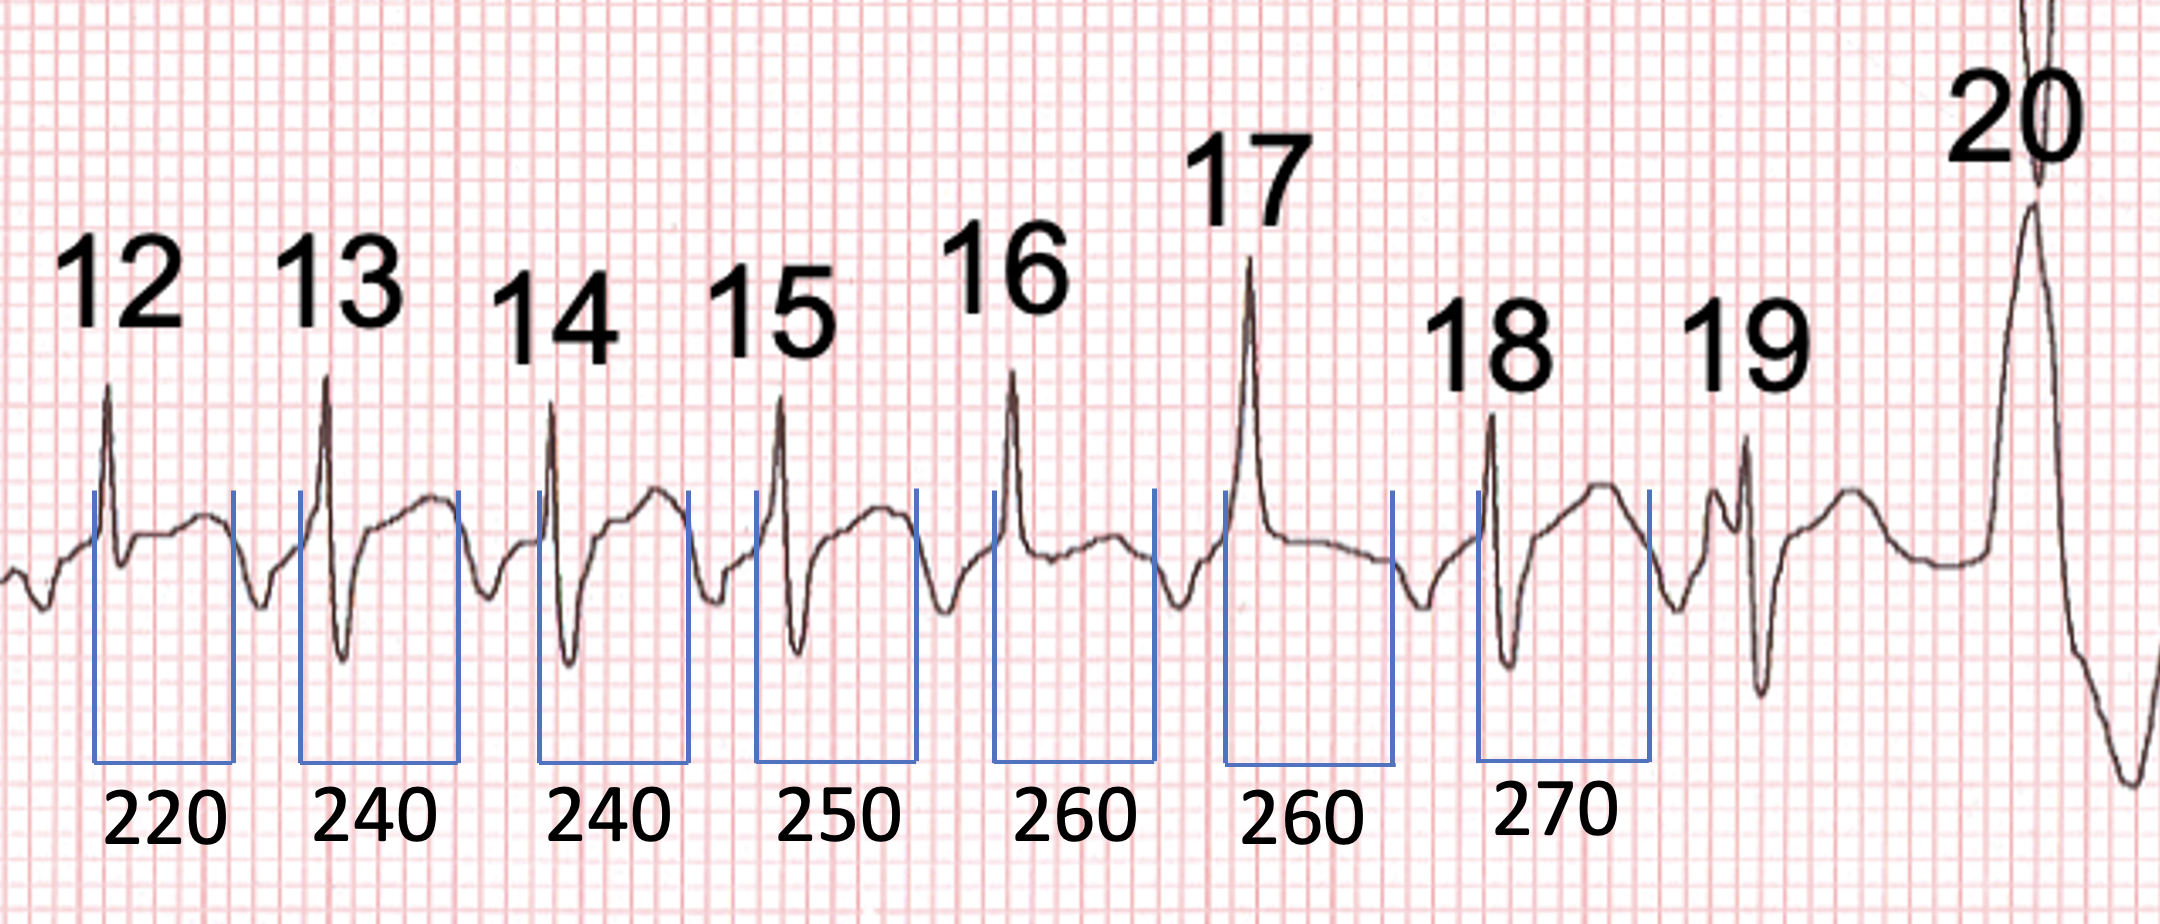
Figure 1. Close-up view of beats 12-20, showing an increasing RP interval before retrograde conduction fails and the SVT stops.
Initial thought was AF with pre-excitation but that’s too obvious…
I was the same, AF with aberrance..
Thanks Mags. Definitely worth considering but I don’t think it’s the answer.
SVT with aberrancy offset by PVC
Possible brugada syndrome seen in v1,v2
Thanks, Ramadan. I initially wondered about aberrancy but how could that explain the continually changing QRS morphology in the middle of the tracing? Tricky. Also, I don’t think it’s typical of Brugada, but I may be wrong.
Polymorphic VT with Atrial Ectopics?
Thanks, Sophie. Polymorphic VT certainly has to be considered when there is a regular tachycardia with continually changing QRS morphology, but how would you explain the narrow complexes? And which beats do you think are atrial ectopics?
As always, an intriguing and challenging case, Dave! Probably worth sharing on Twitter at some point.
I think this is a rare case of two different arrhythmias occurring simultaneously — one supraventricular and the other ventricular.
1. R1 = sinus beat, or at least it seems that way.
2. R2-7 = R20-24 = R26-27 = non-fused beats of RVOT VT, not “LBBB” aberrancy”, as suggested by the LBBB morphology, R/S transition at V3/4, and prominent inferior axis.
**I think the WCT is a tad irregular — not entirely strange for VTs
3. R8-11 = varying degrees of fusion between the SVT and the VT
4. R12 = possibly the only beat of the SVT that is non-fused, or at least non-aberrant
5. R13-15 = R18-19 = non-fused beats of the SVT, which is a long R-P tachy, with inverted P waves in the inferior leads, upright in aVR and V1, and ?biphasic in V3. I believe this to be an AT (with RBBB aberrancy, as seen in V1) from possibly low in the RA. Of course, it could also be an atypical AVNRT or orthodromic AVRT (with RBBB aberrancy), but I think an orthodromic AVRT is unlikely.
**If we go backwards, from R19, we can see the P waves “march through” and then disappear into the WCT — I believe this signals that both arrhythmias co-exist. We know that AVNRTs can march on undisturbed by PVCs if they are His-refractory — no reason why short runs of VT would be any different. ATs also tend to be walled off from the influences from the ventricles. It does not seem like the SVT continues after 19, or at least, it is difficult to tell. I can not see any obvious evidence of atrial activity beyond that point, as we see between R8 and R11.
I am by no means certain. It’ll be interesting to read other thoughts on the matter.
Great comments, Ōkóyè Ō – thanks very much. I think we’re about 90% in agreement but of course it may be you that is correct where we differ. I’ll post my explanation and laddergram in a day or 2 and invite further comment.
VT,F-SAVNRT
Thanks, wck. Could you provide a bit more explanatory detail?
The VT looks like RVOT
Hi Claire. Yes, I agree. What do you think of my explanation of the rest of the ECG?
I am unfortunately a little late to the party, I have been thinking about the specific conduction routes for a while.
Like Dr Ōkóyè, I think we have two different arrhythmias for the price of one! Textbooks show individual examples of different types of arrhythmia and when they co-exist they can be quite challenging to unpick.
I think we have a sinus beat, followed by a run of VT. After beat 7, we see retrograde P waves with a long RP interval, these P waves then appear to conduct through the AV node (beat 10 onwards). I believe that retrograde conduction is caused by atypical re-entry (re-entry along a slow pathway) which in turn, causes conduction through the AV node. This causes fusion with the VT (beats 10 and 11) until the SVT becomes the dominant rhythm (12-19), essentially blocking the VT. Beat 19 has a notch just prior which seems suspicious given that the rhythm then changes back to VT.
I was unsure whether the SVT was orthodromic AVRT or atypical AVNRT and uncertain as to why the SVT doesn’t appear until beat 10 and then stop at beat 19. However, after reading through Dave’s and Dr Ōkóyè’s comments AVNRT makes the most sense. I think Dr Grauer’s may have a theory with regards to the initiation and termination of the SVT.
Thanks Arron. Better to be late to the party than not to turn up! I think we’re pretty much in agreement, although I suspect there are more fusion beats than you think there are. I think an AVNRT is more likely than an AVRT because a developing AVRT would probably be more likely to be instantly terminated by the VT rather than co-existing with it. I’m looking forward to seeing Ken Grauer’s comments.
Hi Dave. This tracing was sent to me without clinical information. Below is what I wrote back (without knowing that the tracing was from you, and already posted on your ECG Blog):
=============================
This is an absolutely fascinating arrhythmia !!!!
— It is WONDERFUL that we have beat #1 — because that is the KEY to this rhythm. Beat #1 is normal sinus conducted (with an upright P wave in lead II !!!!)
— It is because of beat #1 — that I KNOW the negative P wave that we see before beats #13,14,15 are ALL “echo beats” = supraventricular AVNRT of the “fast-slow” type (ie, down the “faster” pathway — and retrograde up the “slower” pathway).
— Beats #2-thru-11 represent a slightly irregular VT (becomes more regular after brief “warm-up”).
— Beats #10 and 11 are clearly ventricular FUSION beats — and by the same token, beats #12, 16, 17 are also FUSION beats.
— So this run of VT initially does NOT conduct retrograde — but we begin to see the SAME negative deflection in the long lead II after ventricular beat #7 — and then beginning with beat #10 there is FUSION!!!! Marriott had a picture of this phenomenon in one of his textbooks that I remember from decades ago — in which VT precipitates are run of “echo beats” that results in an SVT. So the reason there is fusion is retrograde conduction with the “rebound” forward conduction occurring at slightly different points in the cycle — and with those “rebound” echo supraventricular beats then “fusing” with the ONGOING VT! — until the SVT takes over (beats #13-15; and again 18 & 19.
— It’s hard to tell if beat #19 is the same as beat #18 (I think it is — and I think the different shape P wave is artifact — as I think there is the same retrograde conduction before beat #19.)
— If you measure with calipers — ventricular beat #20 occurs ever-so-slightly SOONER than would the next echo beat, which is why VT again takes over. Due to artifact — it is hard to be certain at which point this VT starts conducting retrograde again (I think we see retrograde P waves after beats #24,25,26 — but there is too much artifact to be sure.)
=====================
DAVE — I didn’t have time to draw a laddergram — but since you have, I don’t need to. With a few minor differences — I think our assessments are fairly similar. Perhaps you have the “image” I have of Barney Marriott’s wonderful example of this phenomenon (that I am unable to locate). GREAT case! — : ) Ken
Thanks Ken – absolutely delighted to see you here and joining in the discussion. I think we’re pretty much in agreement, certainly over the most important aspects of the ECG. The only real differences in our analyses are over whether certain beats are ‘pure’ AVNRT or VT, or whether they show minimal fusion, but these differences are immaterial to the overall explanation and probably irresolvable from the ECG. So, it looks like we’ve arrived at a consensus: A VT triggers an AVNRT, which shows variable fusion with the VT until it stops and the VT takes over again. I can now re-file the ECG, moving it from my ‘Don’t know’ folder into another one, although I’m not sure which.
PS I don’t have a copy of the Marriott example you refer to. I may have seen it decades ago – I just can’t remember!